class: center, middle, inverse, title-slide # Week 02 - Introduction to Causality ## How do we know if X causes Y? <html> <div style="float:left"> </div> <hr color='#EB811B' size=1px width=800px> </html> ### Danilo Freire ### 30th January 2019 --- <style> .remark-slide-number { position: inherit; } .remark-slide-number .progress-bar-container { position: absolute; bottom: 0; height: 6px; display: block; left: 0; right: 0; } .remark-slide-number .progress-bar { height: 100%; background-color: #EB811B; } .orange { color: #EB811B; } </style> # Today's Agenda .font150[ * Questions about RMarkdown? * What is causal inference? * Correlation vs causation * Treatment effects and potential outcomes * Randomised Controlled Trials ] --- # Brief Recap .font150[ * Last week you learned how to: - Load `.csv` files - Download datasets from the internet - Create and run `.R` scripts - Create `.Rmd` documents (different extension!) - Print a pdf with your results ] --- # RMarkdown .font150[ * Questions? ] .center[] --- class: inverse, center, middle # Causal Inference <html><div style='float:left'></div><hr color='#EB811B' size=1px width=720px></html> --- # Causal Inference .font150[ * What is causal inference? ] -- .font150[ * Causal: relationship where one factor causes the other ] -- .font150[ * Inference: our ability to derive conclusion from facts and observations ] -- .font150[ * _Causal inference is an attempt to estimate a causal connection between two variables based on an observed effect_ ] --- # Causal Inference .center[] --- # Causal Inference .center[] --- # Causal Inference .center[] -- .font150[Which question is harder to answer?] --- # Causal Inference .center[] --- # Does X cause Y? .font150[ * Does _X_ occur at the same time as _Y_? * If _X_ goes up or down, does _Y_ also go up or down? * If _X_ is happens, does _Y_ also happen? ] -- .font150[* _Are X and Y causally related because of that?_] -- .font150[**NO**] --- # Does X cause Y? .center[] --- # Does X cause Y? .center[] --- # Causal Inference - Notation .font150[ * Treatment variable = _T_ * Two potential outcomes = _Y_ when _T = 0_ and _Y_ when _T = 1_ ] -- .font150[ * Example - Treatment: getting a university degree - Potential outcome: salary with a university degree _(Y when T = 1)_ versus salary without a university degree _(Y when T = 0)_ ] --- # Causal Inference - Notation .font150[ * The causal effect of the treatment _T_ is the difference in _Y_ with and without _T_ * `\(Y(T = 1) - Y(T = 0)\)` or `\(Y_{1} - Y_{0}\)` ] .center[] -- .font150[ * Why is that a problem? ] --- # Fundamental Problem .font150[ * _We can never observe Y where T = 1 and T = 0 at the same time_ * We only observe _one_ outcome at a time, that's why it is called the _potential_ outcomes framework ] --- # Fundamental Problem .center[] .center[[Holland, Paul (1986), p. 947](https://www.jstor.org/stable/2289064)] --- # Sample Average Treatment Effect .font150[ * Solution: we estimate the _average causal effect_ in the groups that received and did not receive the treatment * We call it the _Sample Average Treatment Effect_, or SATE ] .center[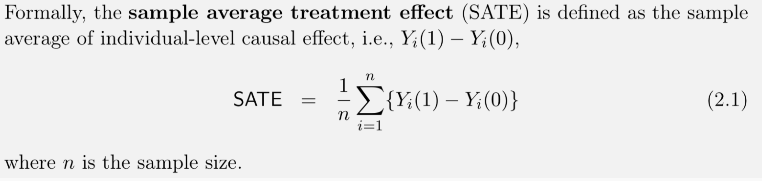] .font150[ * But is that enough? ] -- .font150[ * _Not quite_ ] --- # Randomisation .font130[ * The best solution to the problem of selection bias is _randomisation_ * If the researcher randomised the treatment, she can be sure that it is unrelated to any observable characteristic * We also assume randomised treatment is uncorrelated with any _unobservable_ characteristic too * Randomised Controlled Trials (RCTs): the researcher creates treatment and control groups * If all other characteristics are equivalent on average between the two groups, _the difference between them is caused by the treatment effect_ ] --- # Randomisation .center[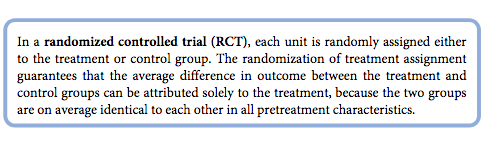] --- # Internal versus External Validity .font150[ * RCTs have very strong internal validity, that is, there is very little chance the result is derived from causes other than the treatment * However, they may not generalise well. Why? ] -- .font150[ * Samples may not reflect the whole population of interest ] --- # Homework .font150[ * Watch these three videos (they're all short): - <https://youtu.be/vtSCZcKXw1w> - <https://youtu.be/9j_HWkrSxzI> - <https://youtu.be/crpuBZv6XtA> * Start `swirl()` CAUSALITY1 ] --- class: inverse, center, middle # See you on Wednesday! <html><div style='float:left'></div><hr color='#EB811B' size=1px width=720px></html>